Introduction
Being able to inspect and debug your HTML and CSS is critical for frontend development. This lesson will take us through the Chrome Dev Tools, which allow you to see detailed information about your elements and CSS rules, as well as assist you in finding and fixing problems in your code.
Lesson overview
This section contains a general overview of topics that you will learn in this lesson.
- You will know how to access the element inspector.
- You will know how to select and inspect specific elements.
- You will know how to test out HTML and CSS in the inspector.
The inspector
To open up the inspector, you can right-click on any element of a webpage and click “Inspect” or press F12. Go ahead and do that right now to see the HTML and CSS used on this page.
Don’t get overwhelmed with all the tools you’re now seeing! For this lesson, we want to focus on the Elements and Styles panels.
Inspecting elements
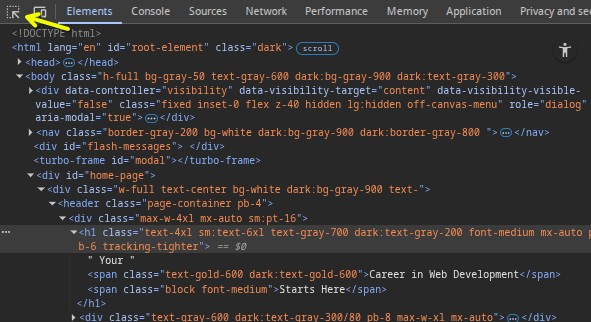
In the Elements panel, you can see the entire HTML structure of your page. You can click on any of the elements in this panel to select that specific element. Alternatively, you can click on the upper-left “element select” icon (shown in the image below), then hover over any element on the page.
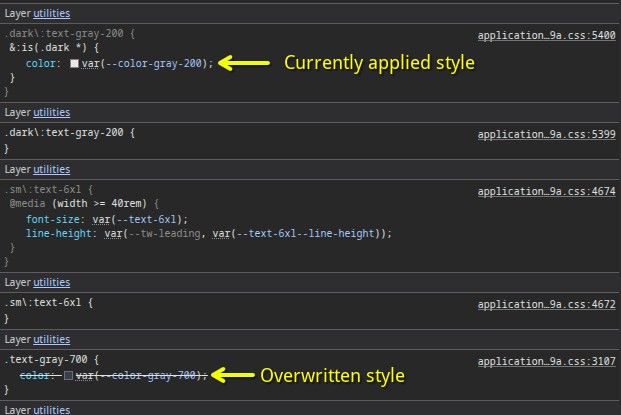
When an element is selected, the Styles tab will show all the currently applied styles, as well as any styles that are being overwritten (indicated by a strikethrough of the text). For example, if you use the inspector to click on the “Your” in the “Your Career in Web Development Starts Here” header on the TOP homepage, on the right-hand side you’ll see all the styles that are currently affecting the element, as seen below (don’t worry about the var() syntax as that’s irrelevant to this point):
Testing styles in the inspector
The Styles panel also allows you to edit styles directly in the browser. You can click inside of any individual selector to add a new rule or click on an existing attribute or value to alter it. When doing so, the webpage responds with the changes in real-time. This won’t affect the source code in your text editor, but it is extremely useful for quickly testing out various attributes and values without needing to reload the page over and over again.
Assignment
-
Go through the following sections of the official Chrome DevTools docs:
- Devtools overview: don’t navigate to any other pages linked here; just get familiar with what tools are available in the DevTools, rather than how to use all of them right now.
- Open Chrome DevTools: similar to what we went over above, but with some nice extras.
- Get Started With Viewing And Changing The DOM: skip through any part that uses the JavaScript console.
- View and change CSS: be sure to follow along with any interactive instructions!
Knowledge check
The following questions are an opportunity to reflect on key topics in this lesson. If you can’t answer a question, click on it to review the material, but keep in mind you are not expected to memorize or master this knowledge.

