Introduction
Tracking down and fixing both errors and unexpected behavior in your code is an inevitable part of being a developer. The art of finding the cause of problems and then fixing them in code is known as debugging. The origin of the term is a classic computer science tale worth reading if you haven’t already.
In this lesson, we’ll cover all of the main techniques you can use to debug your code when you run into a problem.
Lesson overview
This section contains a general overview of topics that you will learn in this lesson.
- Describe what a stack trace is.
- Explain how you can use a stack trace to debug your code.
- Explain how you can use
putsand Pry to debug your code. - Explain how you should decide to start with debugging.
Reading the stack trace
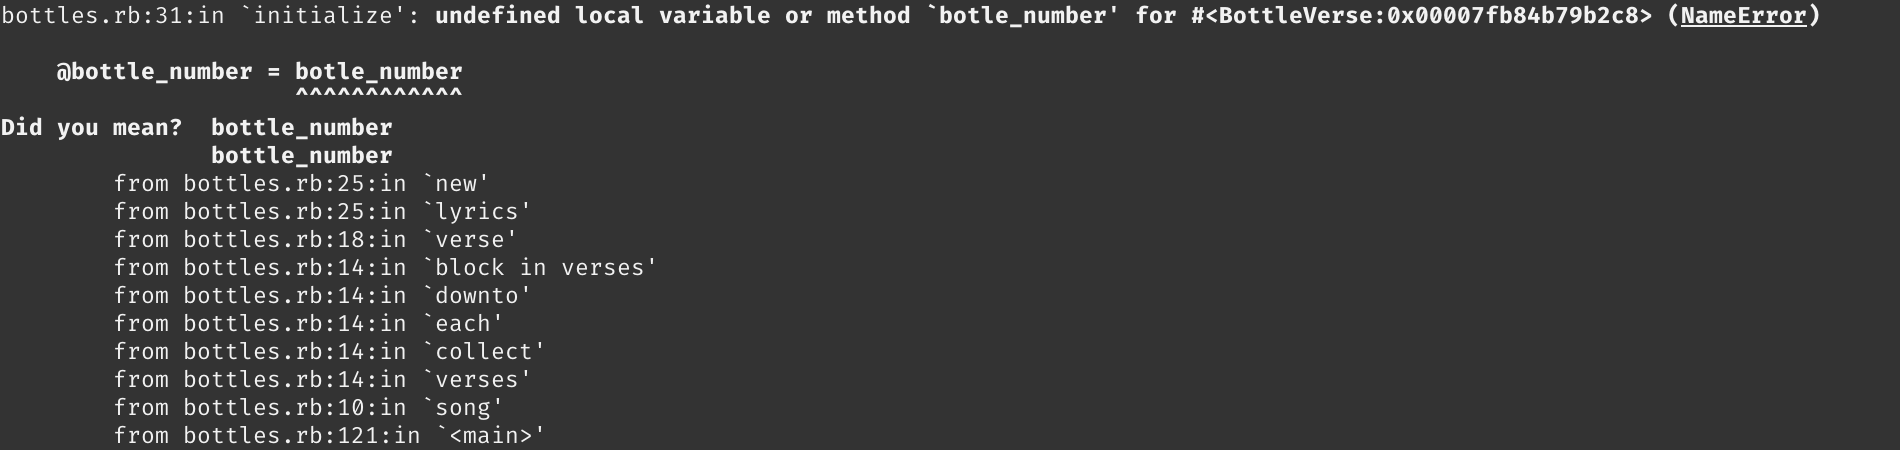
When your Ruby program crashes after encountering a runtime error or exception, it will produce a wall of text known as a stack trace that is then output in your terminal. A stack trace looks something like this:
Don’t let the stack trace intimidate you. You don’t need to read it all or even know what most of it means.
The stack trace prints each line of code in your program that was executed before it crashed. The very first line of the stack trace will generally provide the most useful information about the error your program encountered:

First, this line of the stack trace will tell you what specific line caused the runtime error. In the above example, the error was encountered in line 31 of the file bottles.rb. This line also provides a brief explanation of the error and the name of the error. (In this case, it’s a NameError). And yes, in Ruby, errors are also objects.
There you have it. At this point, you know where in your code the exception is being raised, and you know the type of error you’re dealing with. You might even know what fixes need to be implemented in your code.
But what if you don’t know how to fix your code? Then it’s time to dive into debugging!
Debugging with puts
The debugging process is all about confirming assumptions about your code until you find something that goes against your assumptions. For example, does a variable or method return what you expect? Does a calculation or iteration over an array or hash give the output you expect?
The easiest and quickest way to confirm your assumptions while debugging is by using puts statements to output the return value of variables, methods, calculations, iterations, or even entire lines of code to your terminal.
Let’s say that for whatever reason, we need to write a method that takes a string and checks if the string is an isogram (a word that has no repeating letters) or not. Perhaps it’s a hostage situation that requires a pro debugger? Let’s take a look at a first draft:
def isogram?(string)
  original_length = string.length
  string_array = string.downcase.split
  unique_length = string_array.uniq.length
  original_length == unique_length
end

isogram?("Odin")

#=> false
Okay, that didn’t work. We didn’t expect that. Why? Because the string Odin is an isogram but we got false. The method didn’t throw an exception, so we don’t even have a line to start debugging at. Now what?
We know that original_length == unique_length returns false since it’s the last statement, so why not place a puts on the line before that to see what unique_length is. As an alternative to puts, p is also commonly used for debugging; p is a combination of puts and inspect (more on that below). To better show the differences between what Ruby is printing to the terminal and returning, the examples in this section use the full IRB syntax, which is exactly what you’d see if you typed these commands into your own terminal IRB session.
irb(main):001:1* def isogram?(string)
irb(main):002:1*   original_length = string.length
irb(main):003:1*   string_array = string.downcase.split
irb(main):004:1*   unique_length = string_array.uniq.length
irb(main):005:1*
irb(main):006:1*   p unique_length
irb(main):007:1*
irb(main):008:1*   original_length == unique_length
irb(main):009:0> end
=> :isogram?
irb(main):010:0> isogram?("Odin")
1
=> false
INTERESTING. Using p on unique_length prints it to the console and shows us something must be wrong with how we called #uniq on string_array because we know that we have 4 unique characters in our input but we got 1 as output. For verification, let’s place another p statement before the unique_length statement:
irb(main):001:1* def isogram?(string)
irb(main):002:1*   original_length = string.length
irb(main):003:1*   string_array = string.downcase.split
irb(main):004:1*
irb(main):005:1*   p string_array
irb(main):006:1*
irb(main):007:1*   unique_length = string_array.uniq.length
irb(main):008:1*
irb(main):009:1*   p unique_length
irb(main):010:1*
irb(main):011:1*   original_length == unique_length
irb(main):012:0> end
=> :isogram?
irb(main):013:0> isogram?("Odin")
["odin"]
1
=> false
Indeed, we didn’t use #split correctly, as this particular creates an array with the given string rather than creating an array of characters of the given string. Why? By default, if we didn’t provide arguments, #split will divide the string using whitespace as the delimiter. Try running the above code in a REPL or IRB using #split('') instead, and you’ll see the difference.
Hostage situation resolved! That wasn’t so bad, was it?
Debugging with puts and nil
Using puts is a great way to debug, but there’s a HUGE caveat with using it: calling puts on anything that is nil or an empty string or collection will just print a blank line to your terminal.
This is one instance where using p will yield more information. As mentioned above, p is a combination of puts and #inspect, the latter of which essentially prints a string representation of whatever it’s called on. To illustrate this, try the following in a REPL:
puts "Using puts:"
puts []
p "Using p:"
p []
Debugging with Pry-byebug
Pry is a Ruby gem that provides you with an interactive REPL while your program is running. The REPL provided by Pry is very similar to IRB but has added functionality. The recommended Ruby gem for debugging is Pry-byebug and it includes Pry as a dependency. Pry-byebug adds step-by-step debugging and stack navigation.
To use Pry-byebug, you’ll first need to install it in your terminal by running gem install pry-byebug. You can then make it available in your program by requiring it at the top of your file with require 'pry-byebug'. Finally, to use Pry-byebug, you just need to call binding.pry at any point in your program.
To follow along with these examples save the code into a Ruby file (e.g., script.rb) and then run the file in your terminal (e.g., ruby script.rb)
require 'pry-byebug'

def isogram?(string)
  original_length = string.length
  string_array = string.downcase.split

  binding.pry

  unique_length = string_array.uniq.length
  original_length == unique_length
end

isogram?("Odin")
When your code executes and gets to binding.pry, it will open an IRB-like session in your terminal. You can then use that session to check the values of anything within the scope of where you included binding.pry. However, keep in mind that any code written after the binding.pry statement will not have been evaluated during the Pry session.
For example, here original_length and string_array are in scope. However, unique_length is not in scope, because it is written after binding.pry and has not been evaluated yet.
Thus, adding a binding.pry line in our code is similar to creating a breakpoint in JavaScript.
To see this point in action, try running the following:
require 'pry-byebug'

def yell_greeting(string)
  name = string

  binding.pry

  name = name.upcase
  greeting = "WASSAP, #{name}!"
  puts greeting
end

yell_greeting("bob")
During the session, if you check for the value of name, you will notice that you get back the value bob instead of BOB. What value do you think greeting will return? Yup, it will be nil. This is because name = name.upcase and greeting = "WASSAP, #{name}!" occurred after the binding.pry call and were never evaluated.
Using the same example above, you can use one of pry-byebug’s commands to figure out what name = name.upcase will return. You won’t need to quit the session or add another binding.pry beneath it. Enter next to step over to the next line.
[1] pry(main)> name
=> "bob"
[2] pry(main)> greeting
=> nil
[3] pry(main)> next

     5: def yell_greeting(string)
     6:   name = string
     7:
     8:   binding.pry
     9:
    10:   name = name.upcase
 => 11:   greeting = "WASSAP, #{name}!"
    12:   puts greeting
    13: end

[4] pry(main)> name
=> "BOB"
It stops after evaluating the next line. name now returns BOB. Calling next again will evaluate the following line. Try it out to know what greeting will return. Pry-byebug has a few more commands, play around with them to get a feel of what they do. You can find the commands with a short description of what they do here.
As you can see, using Pry-byebug for debugging achieves the same outcome as puts debugging: it allows you to confirm the assumptions you have about particular parts of your code. If your code is complex, Pry-byebug will probably allow you to debug quicker thanks to its interactive runtime environment. In such scenarios, Pry-byebug will be easier to interact with than having to add puts statements everywhere and re-running your code each time.
There is far, far more that you can do with Pry-byebug, but that’s beyond the scope of this lesson. Check out the Assignments and Additional Resources to find out where you can learn more about this useful gem.
How to start debugging
Programs generally go wrong due to two main reasons:
-
The program encounters an error and won’t run. For example, a typo may cause a syntax error to be raised that causes the program to crash. In this case, Ruby provides a stack trace.
-
The program runs but does not work the way you expect. For example, you expect a method to return a
2, but it actually returns6when you run it. In this case, there is no stack trace.
Obviously, if available, the stack trace is the first place you should look when debugging. If there’s no stack trace, then puts and Pry are the easiest and quickest tools you can use to get yourself back up and running.
Assignment
- Go through the Ruby Guides Ruby Debugging tutorial, which covers the same topics we went over, but in more depth.
- Read through the Exceptions and Stack Traces section of Launch School’s online book Introduction to Programming with Ruby.
- Now that you’re familiar with the basics, we’re going to have some fun with VSCode! Follow the documentation in the VSCode rdbg Ruby Debugger instructions to install the gem and adjust the configuration inside your VSCode’s
launch.jsonfile. If you’re having a hard time figuring out how to navigate to yourlaunch.jsonfile in order to change the configuration, read through this in-depth guide on Debugging with VScode. - Check your VSCode Extensions and make sure the Ruby Extension and the VSCode rdbg Ruby Debugger extensions are installed.
- Now that everything is installed, configured, let’s create a new file which you can call
script.rb. Next copy and paste the very first example in the Debugging with pry-byebug Section. So include everything fromrequire 'pry-byebug'toisogram?("Odin")in our new file. Save the file. - Click the
Run and Debugbutton, open up the folder your script is located in, set a VSCode breakpoint somewhere within the function, and Run the debugger! This should all look very familiar to you, when you hit the VSCode breakpoint it should look similar to the breakpoints you used in the Javascript Developer Tools lesson. But whoa, once we hit thebinding.prybreakpoint we got an interactive REPL to play around with! The best of both worlds! Play around with this, and feel free to reference Debugging with VScode if you get stuck. - Although VSCode’s debugger is a helpful tool that can make debugging simpler, many companies won’t be using it - and will want you to be familiar with debugging using the concepts this lesson focused on: the stack trace,
puts,pry-byebug. Let’s practice them by completing the debugging exercises from the ruby-exercises repo that you previously cloned.
Knowledge check
This section contains questions for you to check your understanding of this lesson. If you’re having trouble answering the questions below on your own, review the material above to find the answer.
- What is a stack trace?
- What is generally the most useful line in a stack trace?
- What are the two things you can learn from the first line of a stack trace?
- How do
putsand Pry help you in the debugging process? - What should you use instead of
putsfornilvalues? - Where should you start with debugging if you encounter a runtime error?
- Where should you start with debugging if your program runs but does not work the way you expect?
Additional resources
This section contains helpful links to related content. It isn’t required, so consider it supplemental.
- Read through HOWTO debug your Ruby code, especially the first section on
putsdebugging, by ReadySteadyCode. - Read the article on Debugging without doom and gloom by Practicing Ruby.
- Poke around Pry’s wiki for a collection of resources that will help you master this invaluable gem.
- Read this brilliant article about reading Ruby error messages.